This page is not created by, affiliated with, or supported by Slack Technologies, Inc.
2016-08-20
Channels
- # alda (2)
- # beginners (6)
- # boot (25)
- # cider (10)
- # clojars (5)
- # clojure (81)
- # clojure-brasil (1)
- # clojure-dev (2)
- # clojure-russia (19)
- # clojure-spec (21)
- # clojure-uk (69)
- # clojurescript (23)
- # code-reviews (15)
- # cursive (3)
- # datavis (1)
- # datomic (8)
- # euroclojure (3)
- # events (5)
- # flambo (15)
- # hoplon (17)
- # jobs-rus (13)
- # lambdaisland (50)
- # mount (5)
- # off-topic (3)
- # om (1)
- # parinfer (72)
- # proton (1)
- # protorepl (1)
- # re-frame (17)
- # reagent (59)
- # videos (1)
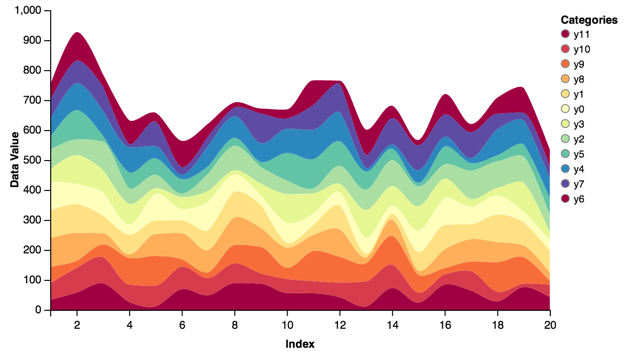
Hey y’all, I want to do a medium-complicated chart (a stacked-area chart, eg http://vincent.readthedocs.io/en/latest/_images/stacked_area1.png ) in ClojureScript. Can anyone suggest an easy-to-use lib? It’s a one-off, so something w/ a short learning curve is ideal. There are between 10 and 15 libs on CLJSJS for charts and graphs, and I’m not looking forward to wading through the list in depth...